ANT Evaluation of the Diurnal Internet
Does the Internet Sleep?
Of course people use computers. But not all the time—people sleep. Computers sleep, too—people suspend their laptop at night, and some computer labs are turned off.

Can we see the Internet sleep? Can we see a diurnal (changing daily) network?
Summarizing the Sleeping Internet
A video summarizing our work:
When the Internet Sleeps from USC Viterbi on Vimeo and on YouTube. (Big thanks to Katherine McKissick at USC Viterbi for putting this video together!)
The Internet, Awake and Asleep
We have pinged the whole responsive Internet, finding the number of active IPv4 addresses every 11 minutes for 35 days.
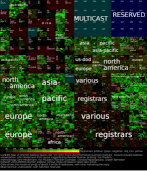
In this animation, show more and fewer active with red and blue, and typical with white. (Typical is the average over the whole measurement.)
(HTML5 video)
We see that parts of the Internet sleep: they have more active addresses (red) during the day and at sunset, and fewer (blue) in the early morning darkness and just after sunrise. Other parts of the Internet are much more stable (always white).
We see large diurnal behavior in eastern Europe, India, China, and South America. We see little diurnal behavior in the US and western Europe.
What Does “Sleep” Mean? Examining Two Blocks
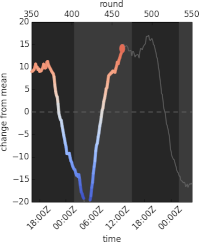
We consider networks to sleep when the number of addresses in use changes with a daily (diurnal) pattern.
As an example of diurnal networks, we zoom in on eastern Europe and look at two regions for two days. Warsaw, Poland (on the left) has fairly stable networks, with changes of 4% or less, while Minsk, Belarus (right) shows usage swings of 15%. In both cases, highest activity is between noon and midnight, while lowest is shortly after local dawn. We also see network usage in Europe west of Poland generally varies less than parts of eastern Europe like Belarus and Russia.
Why Study Sleep?
There are several reasons it is important to understand how the Internet sleeps.
Sleep reflects network policy:
 Fast, broadband networks are seen as economic enablers,
making Amazon shopping, Netflix movies, and Google docs, all just as possible
as thousands of cat videos.
The U.S. Federal Communications Commission has made an always-on connection to the Internet
part of the definition of broadband and
a national goal (see their 2010 report),
and fast, always-on networks are changing life in Korea, Japan, China, and Europe.
Fast, broadband networks are seen as economic enablers,
making Amazon shopping, Netflix movies, and Google docs, all just as possible
as thousands of cat videos.
The U.S. Federal Communications Commission has made an always-on connection to the Internet
part of the definition of broadband and
a national goal (see their 2010 report),
and fast, always-on networks are changing life in Korea, Japan, China, and Europe.
Sleep correlates with other factors: Our technical paper on the diurnal Internet that sleep correlates with other factors: more diurnal networks correlate with lower Gross Domestic Product, more recently Internet allocations, and the combination of recently Internet allocations and per-capita electrical usage. We also quantify how when a region sleeps predicts where on the globe you are (as seen in our animations). Our study of these correlations is just beginning, but studying the correlation of the network and economics and location help us understand our world.
Sleep affects outage detection:
 As we depend on our networks, we need to understand how robust they are.
For several years our research group (ANT) has been
measuring and assessing network outages
(technical papers:
general and
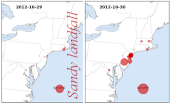
Sandy analysis,
dataset).
To measure outages accurately
we must not confuse a sleeping network
with a network outage
(fewer active addresses with no active addresses).
As we depend on our networks, we need to understand how robust they are.
For several years our research group (ANT) has been
measuring and assessing network outages
(technical papers:
general and
Sandy analysis,
dataset).
To measure outages accurately
we must not confuse a sleeping network
with a network outage
(fewer active addresses with no active addresses).
How big is the network?
 Since 2003,
our research group (ANT) has been
studying how big is the Internet,
starting with our Internet censuses
(browse,
video explanation,
technical paper,
datasets).
Although a seemingly simple question, answering it,
and understanding the accuracy of that answer,
is a surprisingly difficult problem.
Sleep changes our estimate of the Internet's size
(and somewhere, some blocks are always sleeping).
Since 2003,
our research group (ANT) has been
studying how big is the Internet,
starting with our Internet censuses
(browse,
video explanation,
technical paper,
datasets).
Although a seemingly simple question, answering it,
and understanding the accuracy of that answer,
is a surprisingly difficult problem.
Sleep changes our estimate of the Internet's size
(and somewhere, some blocks are always sleeping).
What Causes Sleep?
We are still working to understand the underlying causes of sleeping networks. It is well established that network traffic changes diurnally, as a result of human use of the network, from web browsing and video to e-mail. We believe our work goes a step further to show that the number of computers on the network changes over the course of a day. We believe these changes correspond to people suspending laptops and shutting off desktops, and to computer labs and Internet cafés shuting down at night.
But why do people turn off computers at night? More work is needed to understand root causes. We see a correlation between diurnal networks and lower per-capita GDP (Gross Domestic Product), so economics are a factor. There are almost certainly several underlying reasons, and the mix of reasons likely varies by country. One reason is the sophistication of the network, since (always-on broadband technologies such as cable modems and fiber-to-the-home are designed to never be turned off, while dial-up telephones that are shared with voice calls are designed to be used occasionally. Another reason is infrastructure: if your electricity goes out, keeping the Internet up is probably not your top concern. Policies matter: some countries telecommunications companies discourage always-on and static IP addresses. Sometimes these policies are rooted in technical issues: if your ISP does not have enough IP addresses they may encourage their customers to not linger on-line.
How Do We Observe Sleep?
We observe the Internet, probing it, lightly, to find diurnal blocks by their regularity. We summarize these steps below and provide details in our peer-reviewed technical paper.
Observing Sleep: What we study
We study as much of the whole Internet as will support our measurement methods—currently about 4 million network blocks. (The animation above uses 3.7 million network blocks.)
Specifically, we study the public, IPv4 Internet, probing all blocks where at least 15 addresses have ever responded to an Internet census, and omitting those blocks that have opted out of our work.
We probe the Internet in network blocks, groups of 256 adjacent IP addresses. IPv4 addresses are identified by four numbers, like 192.0.2.1. In a network block the top three numbers are the same, so the network block 192.0.2.* includes addresses 192.0.2.0 to 192.0.2.255. One often writes blocks showing just the numbers that are the same, so this example would be 192.0.2/24 because the first 24 bits of the 32-bit IPv4 address are the same.
Observing Sleep: The Big Picture
Since 2006 we've taken Internet Censuses,
probing
56 million network blocks over 2 months,
almost all the IPv4 addresses.
We probe addresses with pings (technically: ICMP echo requests). These messages ask if there is a computer listening at that address. Computers may reply or not; if they reply we know there is a computer there. Sometimes they reply with an error message. Most often we get no reply, either because there is no computer or because it chooses not to reply.
We know that our census is imperfect: our probes are blocked by firewalls, we may see home routers but we cannot see computers behind those routers. But we believe our census provides the best available view of the Internet's edge, and we have quantified sources of error on our technical publications.
Observing Sleep: A Soft Touch
For long-term measurements such as ours it is critical to work with a light touch. We must make certain our measurements do not harm the network or its users, both because scientific ethics require that we "do no harm", and pragmatically, our work depends on the willingness of users to reply.
We detect diurnal networks by
reanalyzing data from our Trinocular outage detection system.
Today Trinocular probes
4 million network blocks every 11 minutes
(our animation uses earlier data with 3.7 million blocks).
It can run from a single computer, although we often observe from several locations
to provide redundancy.
To probe with a light touch, we only probe a sample of addresses in each block. Typically we send 20 probes per block each hour. We systematically cycle through all addresses that have responded before.
Probing lightly requires that we use careful methods to estimate how busy each block is, but it keeps traffic on target networks very low. Our measurements are less than 1% of the traffic that naturally occurs to any computer on the Internet (“background radiation”). We have described our approach in detail in our technical publication.
Observing Sleep: Finding Diurnal Blocks
 In 2014 we demonstrated that
we can detect diurnal blocks using this data.
In 2014 we demonstrated that
we can detect diurnal blocks using this data.
We have analyzed the 3.4 million network blocks that include geolocation, using Trinocular data taken over 35 days.
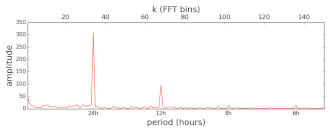 We find periodicity in address use with spectral analysis—we take an FFT (Fast Fourier Transform) of
the address usage in each block.
A strong diurnal block is one where the 24-hour period is strongest
(has the greatest amplitude),
and twice as strong as all other frequencies.
In a relaxed diurnal block, the 24-hour period is strongest,
but others may also be strong.
Details are in our
technical publication.
We find periodicity in address use with spectral analysis—we take an FFT (Fast Fourier Transform) of
the address usage in each block.
A strong diurnal block is one where the 24-hour period is strongest
(has the greatest amplitude),
and twice as strong as all other frequencies.
In a relaxed diurnal block, the 24-hour period is strongest,
but others may also be strong.
Details are in our
technical publication.
Finally, we place each IP address on the globe with Maxmind's GeoLite City data. This freely-available dataset is known to be imprecise, locating some networks in the geographic center of the country when it lacks better information. (This discrepancy is largest in several African countries—Libya does not have a huge network in the middle of the Sahara.) Since single blocks can be noisy, we plot only regions with at least five blocks.
Observing Sleep: The Results
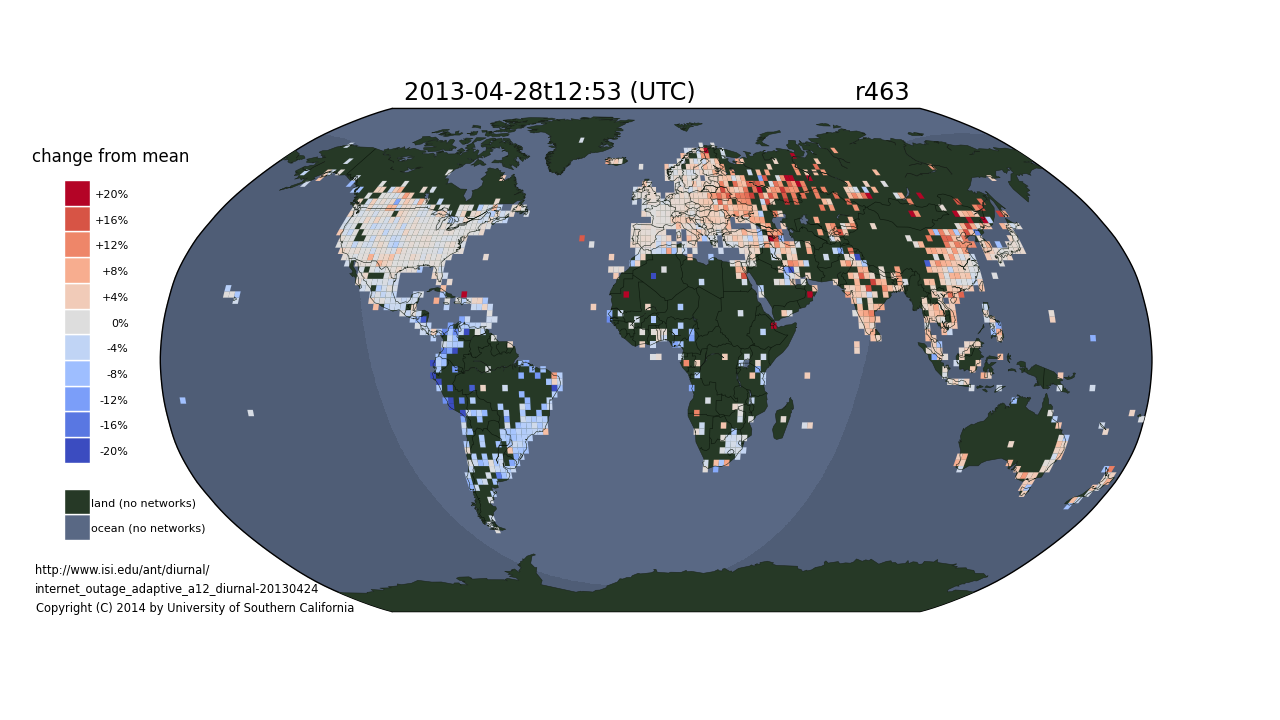
The result of our analysis our animation that shows how the Internet changes over 35 days. In this still frame, you can see that South America is has fewer active addresses (it is blue) because there it is early morning, while Eastern Europe, where it is afternoon, is more active (red).
Where Next?
- Technical details are in our peer-reviewed paper When the Internet Sleeps: Correlating Diurnal Networks With External Factors by Quan, Heidemann, and Pradkin, ACM IMC, Nov. 2014.
- Find out about Trinocular outage detection, the source of our data
- Learn about and browse our Internet Censuses, snapshots of IPv4
- Get our datasets: internet_outage_adaptive_a12_diurnal-20130424, internet_outage_adaptive_a12_supplement-20130831, internet_outage_adaptive_a12all-20130424, and related datasets.
- Source code to our diurnal analysis tools are available on request from the paper authors.
Credits
This animation is by John Heidemann, based on research by Lin Quan, John Heidemann, and Yuri Pradkin (USC/ISI), with animation suggested by Robert Perkins (USC) The cartoons of Internet users are by Genevieve Bartlett.
This research is partially sponsored by the Department of Homeland Security (DHS) Science and Technology Directorate, HSARPA, Cyber Security Division, BAA 11-01-RIKA and Air Force Research Laboratory, Information Directorate under agreement number FA8750-12-2-0344, and via SPAWAR Systems Center Pacific under Contract No. N66001-13-C-3001. The U.S. Government is authorized to reproduce and distribute reprints for Governmental purposes notwithstanding any copyright notation thereon. The views contained herein are those of the authors and do not necessarily represent those of DHS or the U.S. Government.
This work was classified by USC's IRB as non-human subjects research (IIR00001648).
We thank Brian Yamaguchi (USC/ITS) for guidance about USC networks. We thank our Trinocular hosting sites: USC/ISI; CSU: Christos Papadopoulos; WIDE/Keio University: Rod Van Meter, Yohei Kuga, and Midori Kato; and Athens University of Economics and Business: George C. Polyzos and George Xylomenos.