Evaluation of Hurricane Florence's Effects on the Internet's Edge
At 7:15am EDT (11:15 UTC) September 14, 2018, Hurricane Florence made landfall near Wrightsville Beach, North Carolina, displacing more than 30,000 people, and costing more than 45 lives (as of 2018-09-23).
Here we evaluate what outages in the edge networks Internet can say about damage on the ground.
Summary Of Results
What We See: We were able to see the effects of Hurricane Florence on the Internet through our Trinocular outage detection system.
We see that landfall was followed by serious Internet outages in less populated areas north of Wrightsville. We saw addition outages, some further inland, over the next 24 hours. Internet outages declined by 93 hours after landfall
Although we know there was serious flooding and disruption, our observations suggest that Florence cause much less disruption to the Internet than did Hurricane Harvey in Texas in 2017, and news reports seem to support that observation.
Why Does This Matter? Our analysis shows we can observe the results of a hurricane on edge networks of the Internet. Outages in edge networks reflect people’s homes losing utilities and power–therefore we can use the Internet to infer storm damage on people’s lives.
Observations about Internet outages due to storm damages provide unique details about the geographic scope and seriousness of damage. Our inferences can complement other sources of information. News reporters and people on the scene put a human face on how the hurricane affects individuals. But our quantitative measurements of storm damage can help first responders understand where problems are occurring before people call in, and for neighborhoods that have lost communications. Utilities will report on service outages, but during the event they are busy restoring services, so formal reports often follow days later.
Where From Here? We have been working since 2017 to deploy near-real time outages. Currently in testing, we hope to make it available by the end of calendar year 2018.
How Did We Get Here? Our work is currently supported by the Department of Homeland Security, Science and Technology Directorate, Cyber Security Division through the DIVOICE program (evaluating disruptive events in the Internet), and the IMPACT (Information Marketplace for Policy and Analysis of Cyber-risk and Trust) program (basic outage data collection and distribution), through and NSF/CISE Hurricane Harvey RAPID grant IIOVADR, and through a Michael Keston Research Grant at USC/ISI. We are also collaborating with the FCC to evaluate if our work can complement DIRS, to improve assessment of U.S. telecommunications during disasters.
More Details
What Did We Find?
We recently animated our data showing Hurricane Florence landfall:
(HTML5/MPEG-4 video)</p>
Before Landfall
We observe all networks in the world where at least 15 addresses respond to Internet pings (ICMP echo requests). Each network is a block of 256 adjacent IPv4 addresses (addresses 192.0.2.0, 192.0.2.1, up to 192.0.2.255 make up the network 192.0.2.0/24)
In the Carolinas we see thousands of networks.
To visualize the these networks, we:
- Observe the network with Trinocular, measuring its status every 11 minutes.
- Gather this data to USC/ISI and analyze the data, filtering out noise and blocks that we cannot measure.
- Geolocate each network, mapping its IP addresses to a physical location using Maxmind’s Geolite City database.
- Group these blocks into grid cells by latitude and longitude (here we use grid cells on half-degrees).
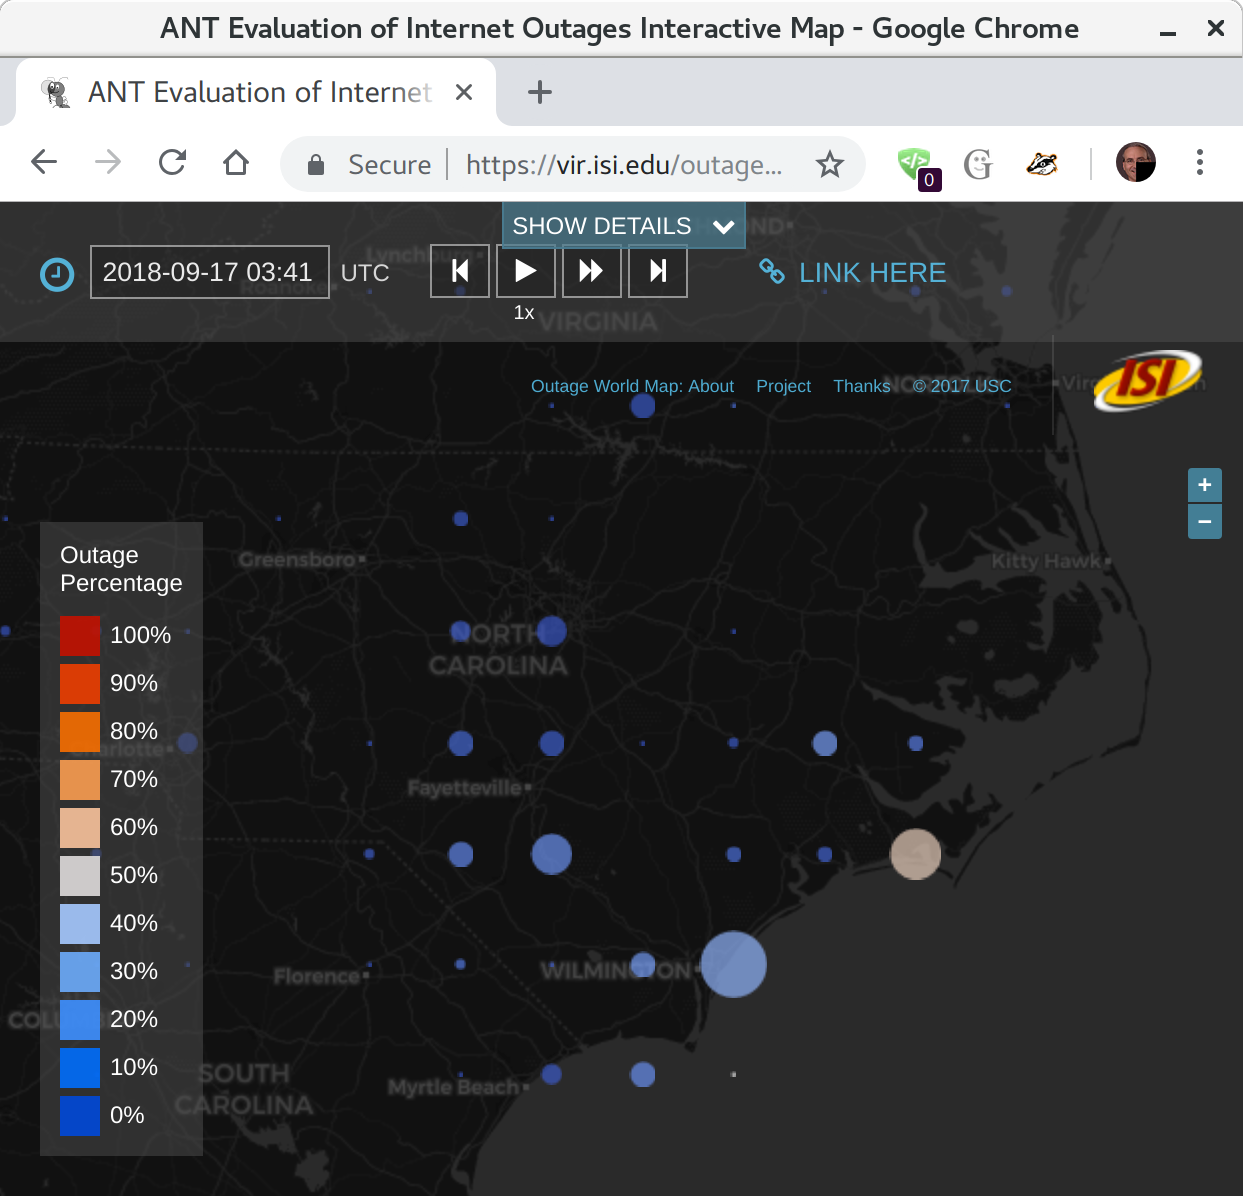
- Plot a circle for each grid cell, where
- the area shows how many networks are out in that area at any given time
- the color shows what fraction of networks out in that area Thus big circles show places where many networks are out, and white and red circles show places where most of the networks are out.
Before Hurricane Florence makes landfall we see a few outages (a small circles are visible), but they are a tiny fraction of all the networks in Texas (the circles are all dark blue).
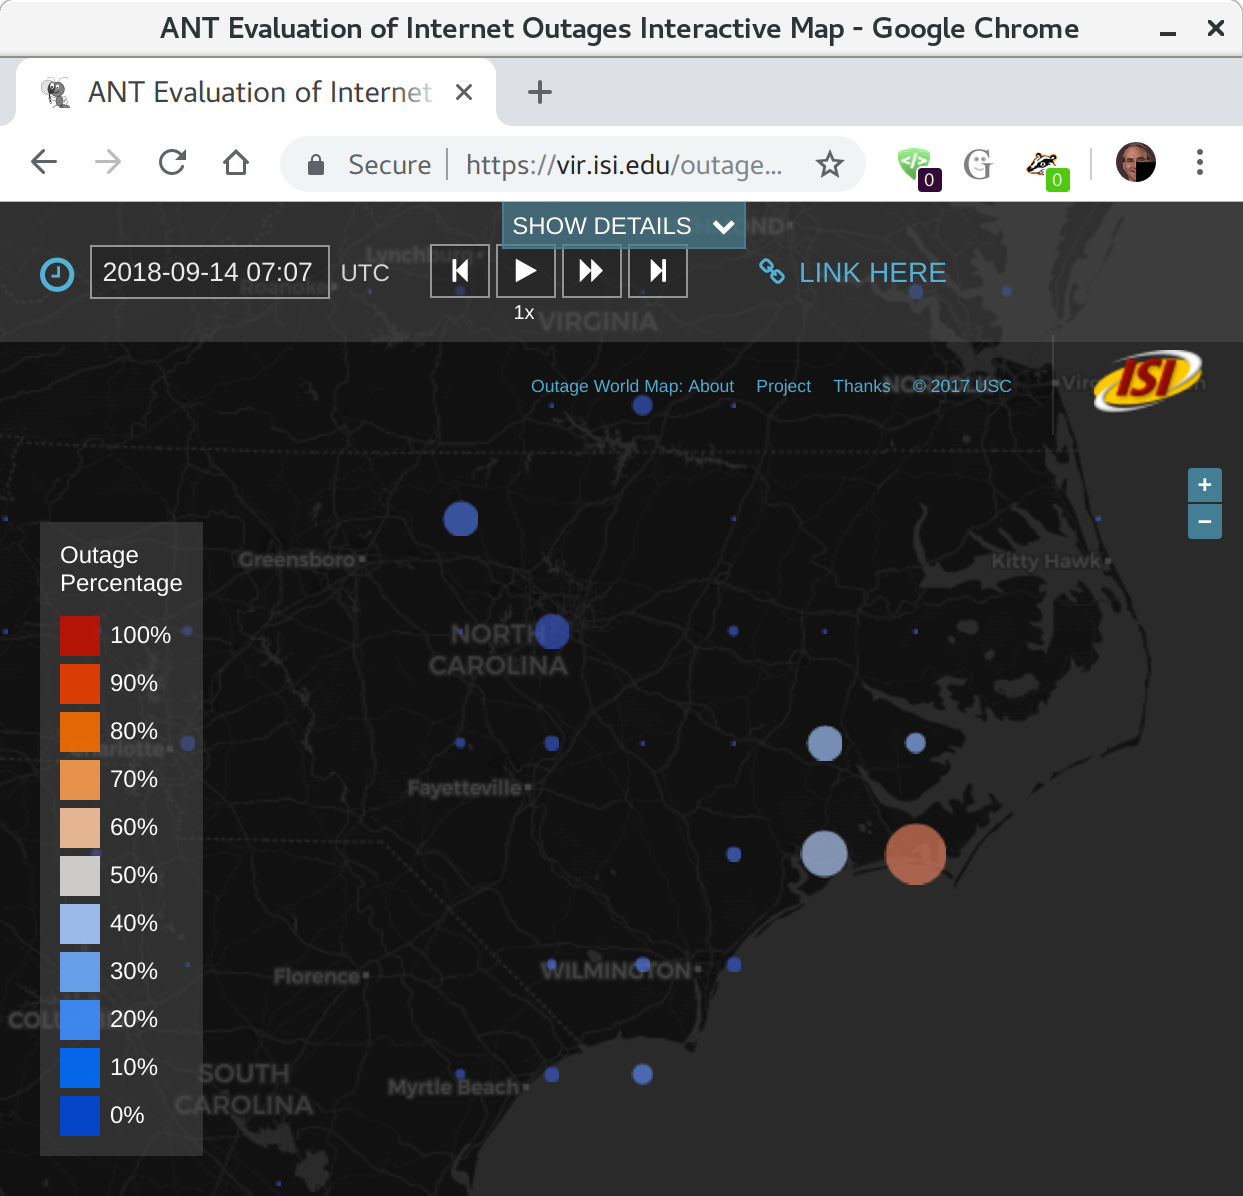
Shortly After Landfall
Hurricane Florence made landfall at 2018-09-14t11:15Z (September 14, 7:15am EDT) near Wrightsville Beach, North Carolina.
Because the hurricane is large, we see outages north of Wrightsville before landfall, and at landfall:
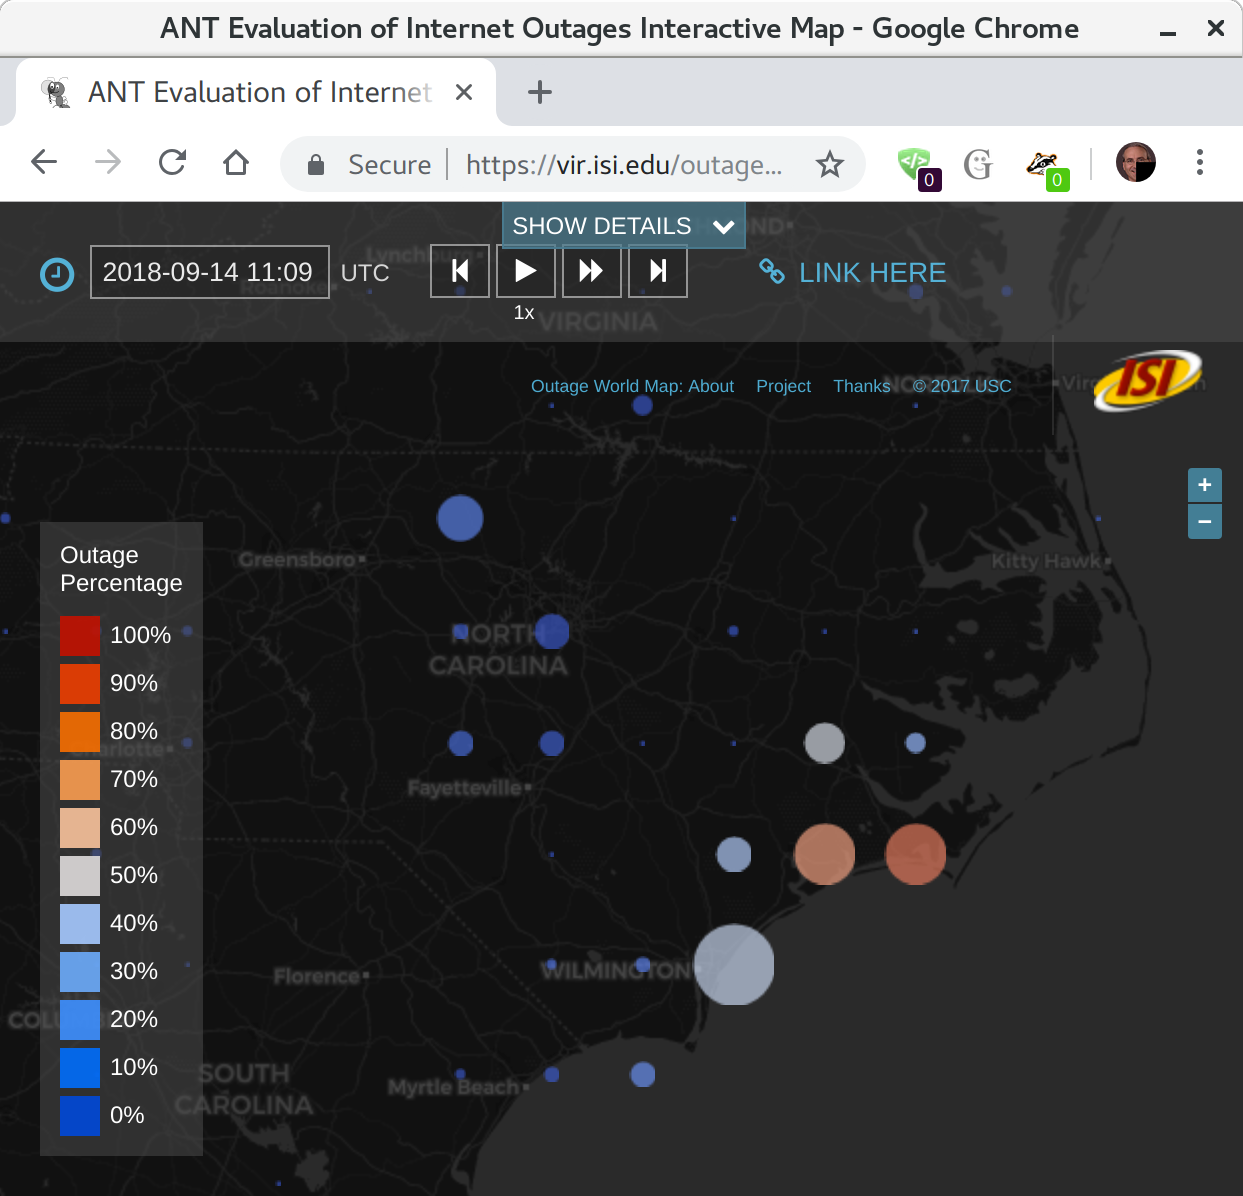
Comparing this visualization to what we saw the day before, we see signficant outages on the coast north of Wilmington. These areas do not have that many networks (the circles are not huge), but many of them became unreachable (the cricles are white or red).
The Following Two Days
In the following two days we saw outages increase and spread inland somewhat. Finally, almost three days after landfall, networks (and the people, we hope!) are recovering.
One day (24 hours) after landfall:
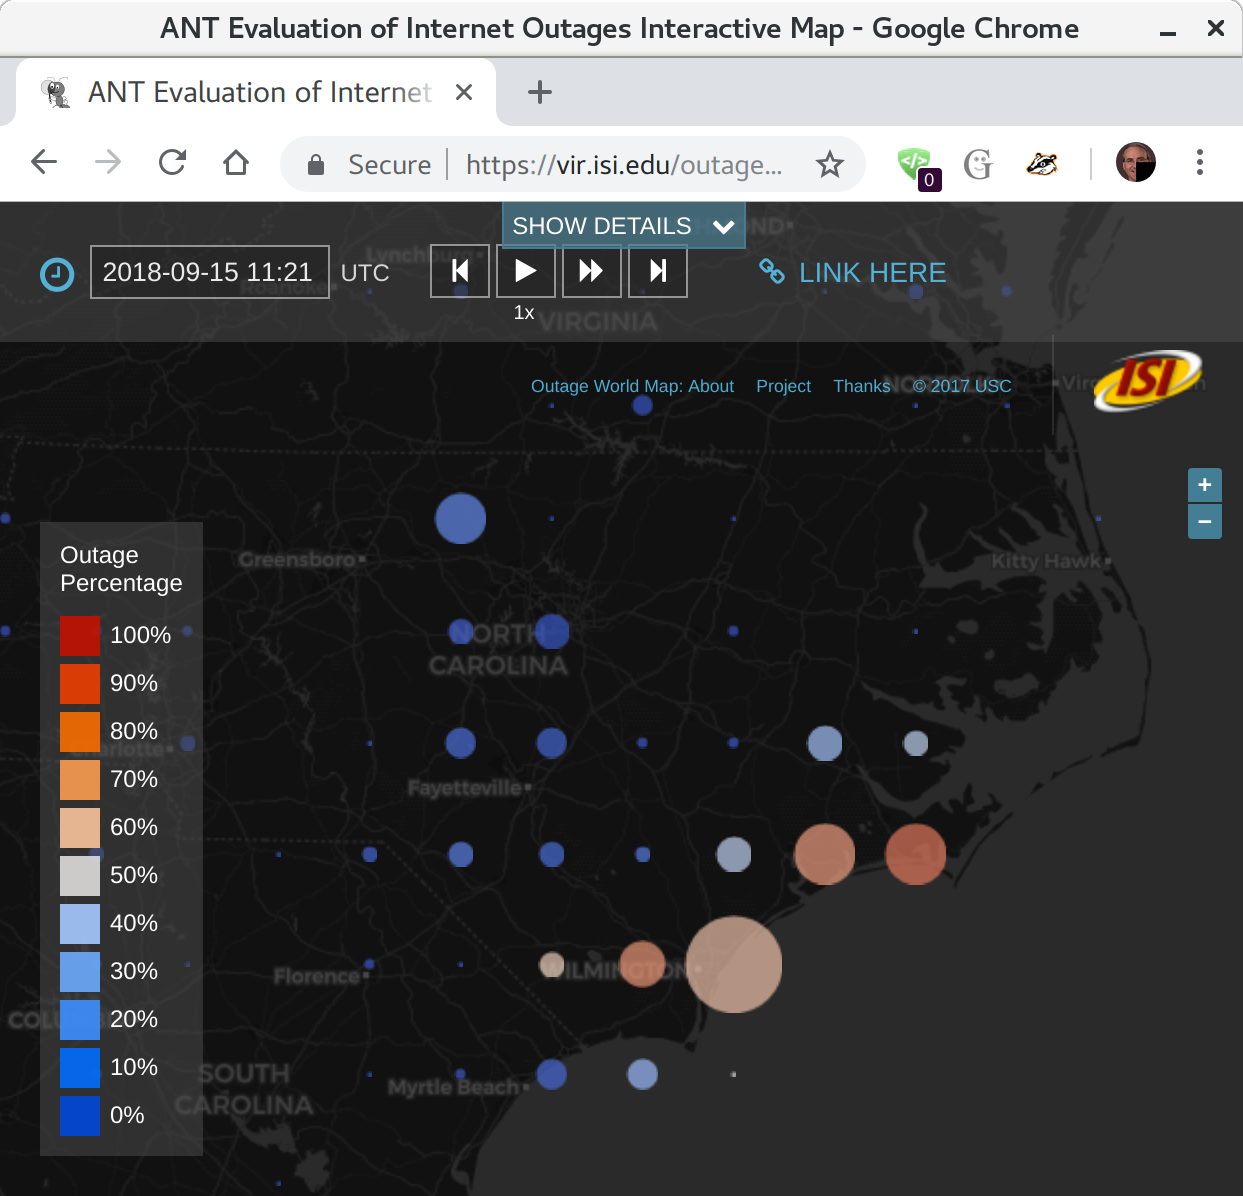
Two days (48 hours) after landfall:
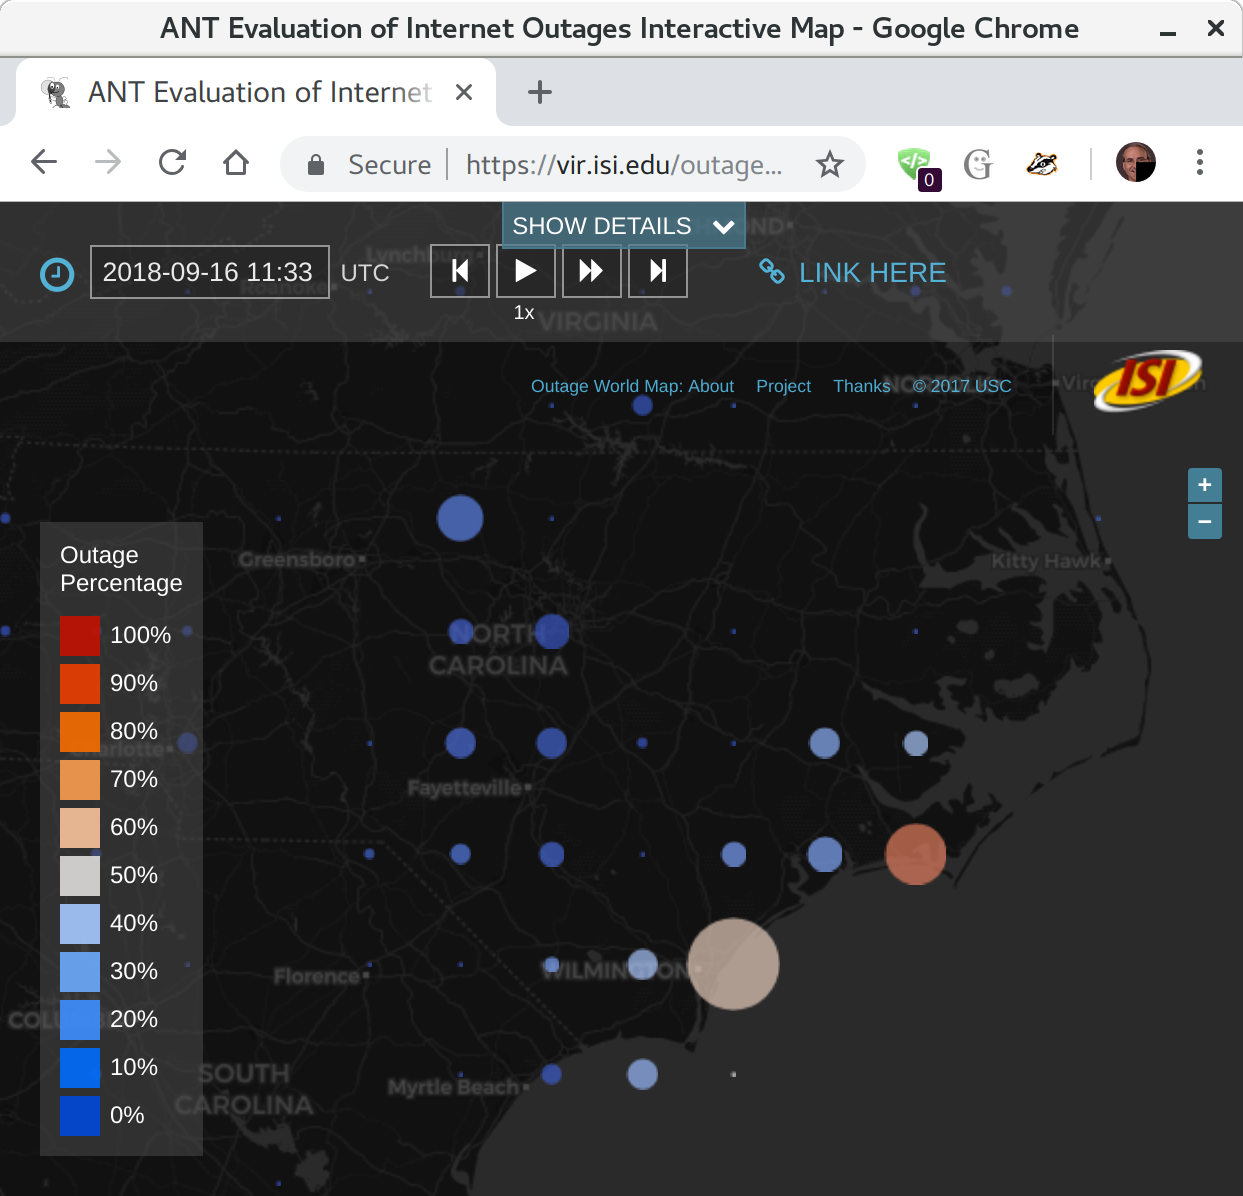
Almost days (93 hours) after landfall:
Things We Do Not See
A few caveats about our work:
-
We are studying Internet edge networks, not the backbone networks. Our understanding is that the core Internet routing did well during Hurricane Florence. The core Internet is very reliable, with multiple paths connecting telecommunications facilities with backup power and storm hardening. Edge networks are more vulnerable, since they usually have one physical connection to the Internet and one source of power, both the wires into a house.
-
We study edge networks, not individual computers. We don’t know who uses individual IP addresses (and we don’t want to know), and in many ISPs, the association of individuals with IP addresses change over time.
-
Currently we are processing data quarterly and on demand, not continuously. We did special processing for this event. We are working towards near-real-time reporting of network outages, and we will report on it as it becomes available.
What Are We Doing to Improve Our Understanding?
We have been studying network outages since 2011.
Research and Peer-Review: Our Trinocular outage detection system is the only peer-reviewed (DOI), active outage detection system that is able to continuously evaluate outages in millions of edge networks around the globe. It complements prior work in detecting routing outages (for example, Hubble in NSDI 2008, or LIFEGUARD in SIGCOMM 2012), weather-triggered Internet outages, and passive observations of network outages.
Data: We release all data collected through Trinocular through the DHS IMPACT program—please see our outages dataset page, all our datasets, and the IMPACT portal for information about obtaining this data.
The dataset including Hurricane Florence will be internet_outage_adaptive_a33all-20180701
and will be released in October 2018.
Broader Efforts: Our work is supported by the Department of Homeland Security, Science and Technology Directorate, Cyber Security Division through the PARIDINE program (analysis and algorithm development), and the IMPACT (Information Marketplace for Policy and Analysis of Cyber-risk and Trust) program (basic outage data collection and distribution), through NSF/CISE via a Hurricane Harvey RAPID, IIOVADR, and through a Michael Keston Research Grant at USC/ISI.
We are also collaborating with the FCC to evaluate if our work can complement DIRS, to improve assessment of U.S. telecommunications during disasters.
This analysis and data collection was done by John Heidemann, Yuri Pradkin, and Guillermo Baltra of USC’s Information Sciences Institute,
This page was last updated on 2018-09-24.