An Animation of the August 2014 Time Warner Outage
On August 27, 2014, Time Warner suffered a network outage that affected about 11 million customers for more than two hours (making national news). We have observing global network outages since December 2013, including this outage.
Animating the August 2014 Internet Outage
We recently animated three months of network outages, and here we show the August 2014 Time Warner outage:
(HTML5/MPEG-4 video)
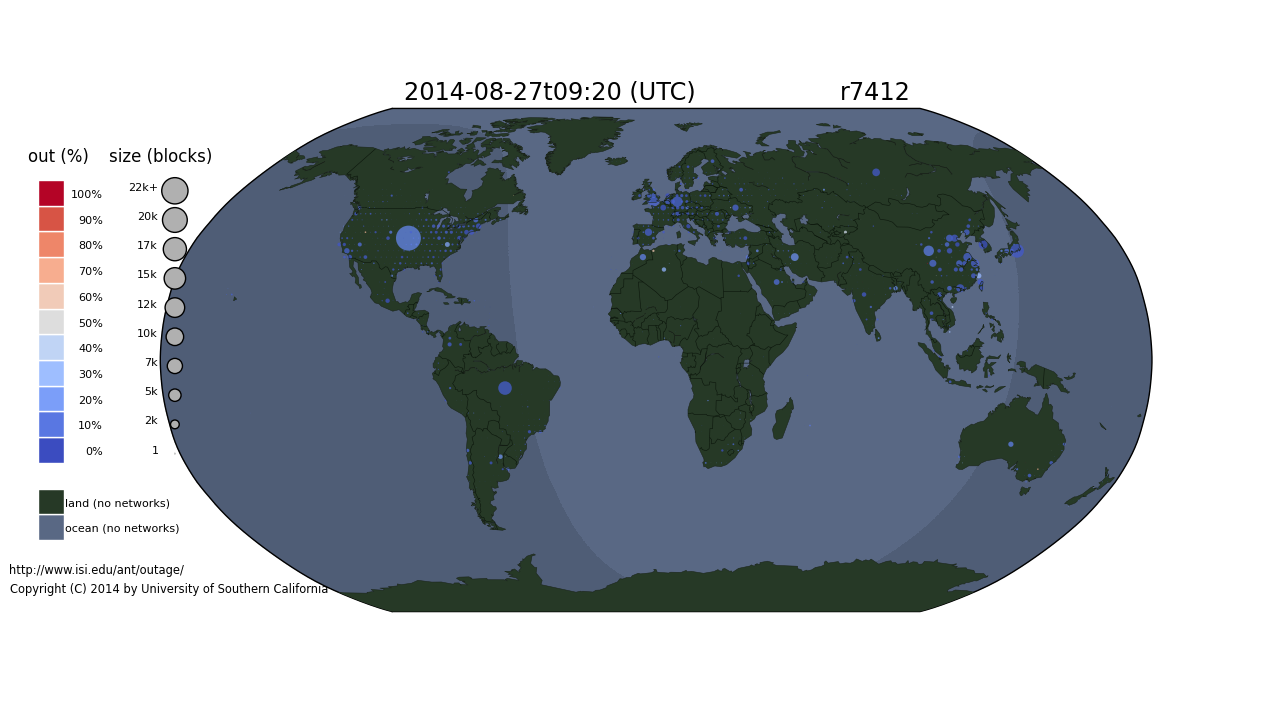
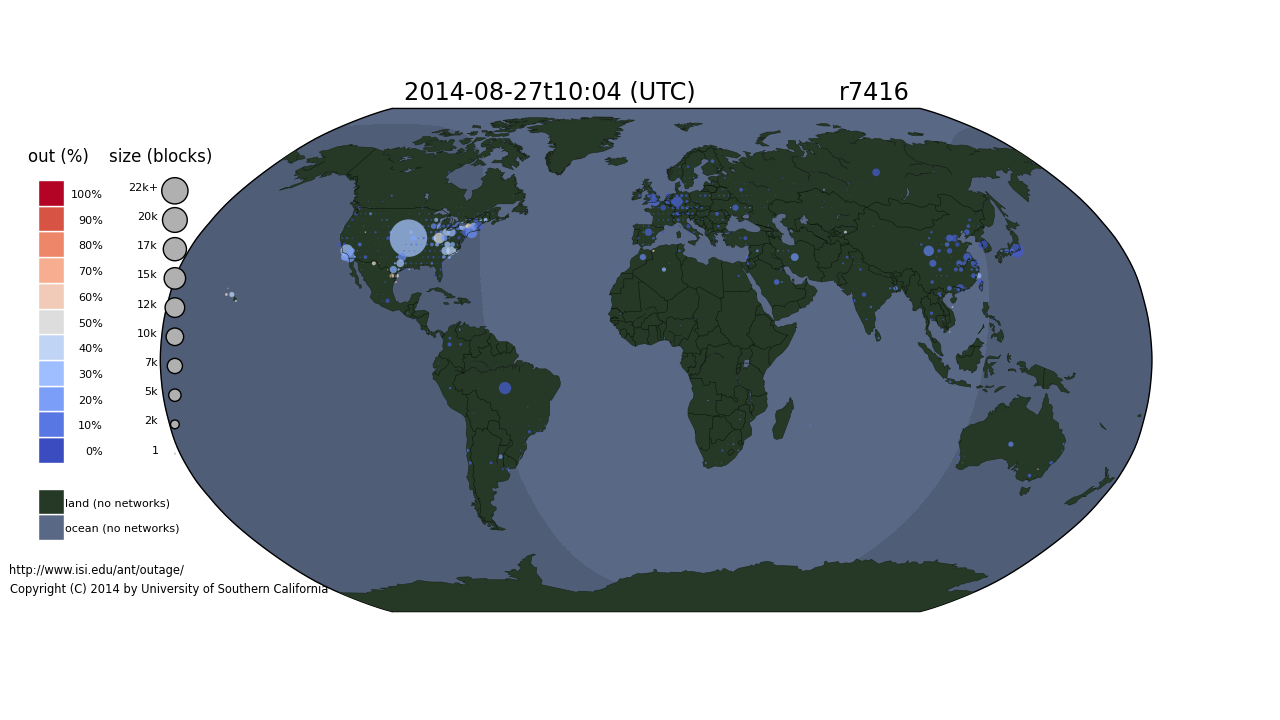
The circles in this animation are proportional to the number of outages in each geographic region (roughly how many people are affected). The color shows the fraction of networks in that region that are down (roughly how likely some person in that location is affected).
We see that the Time Warner outage lasted about two hours and affected a good swath of the United States. We caution that all large network operators have occasional outages–this animation is not intended to complain about Time Warner, but to illustrate the need to have tools that can detect and visualize national-level outages.
A close observer can also observe a few other outages in Uruguay, Brazil, and Saudi Arabia. (The circles that exist for the whole animation are likely measurement errors.)
Before and After
The outage can best be seen by comparing:
before
during
after

Getting the Data
This analysis uses dataset
usc-lander / internet_outage_adaptive_a17all-20140701, available for
research use from PREDICT,
or by request from us
if PREDICT access is not possible.
This animation was first shown at the Dec. 2014 DHS Cyber Security Division R&D Showcase and Technical Workshop as part of the talk “Towards Understanding Internet Reliability” given by John Heidemann. This work was supported by DHS, most recently through the LACREND project.