Eight Years of Internet IPv4 Censuses: 2006 to 2014
We've been taking Internet IPv4 censuses regularly since 2006. In each census, we probe the entire allocated IPv4 address space. (You may browse all our data at our IPv4 address browser.
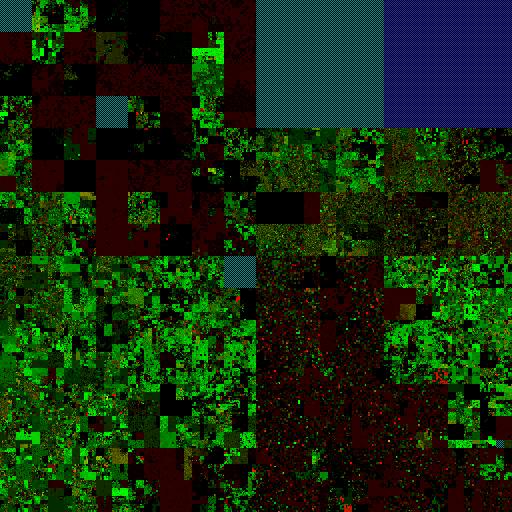
This animation shows 8 years of IPv4 censuses, from 2006 through 2014:
(HTML5/MPEG-4 video)
Some key events:
 2006-06-16 (it13w): Early in our study, observe how much of the Internet is dark blue. That color are regions we do not probe because ICANN had not allocated them at the time.
 2011-02-20 (it39w): In Feb. 2011 ICANN fully allocated the IPv4 address space,
giving out the last /8 blocks to the five regional registries.
 2014-08-29 (it61w): In recent (2013 and 2014), you can observe the internet "filling in"
as the dark areas become brighter and brighter (more green).
This color change corresponds with utilization rising.
All data shown here can be browsed at our website. It is available research use from PREDICT or by request from us if PREDICT access is not possible.
This animation was first shown at the Dec. 2014 DHS Cyber Security Division R&D Showcase and Technical Workshop as part of the talk "Towards Understanding Internet Reliability" given by John Heidemann. This work was supported by DHS, most recently through the LACREND project.
![[ANT logo]](../images/logos/ant_logo_1_128px.png)